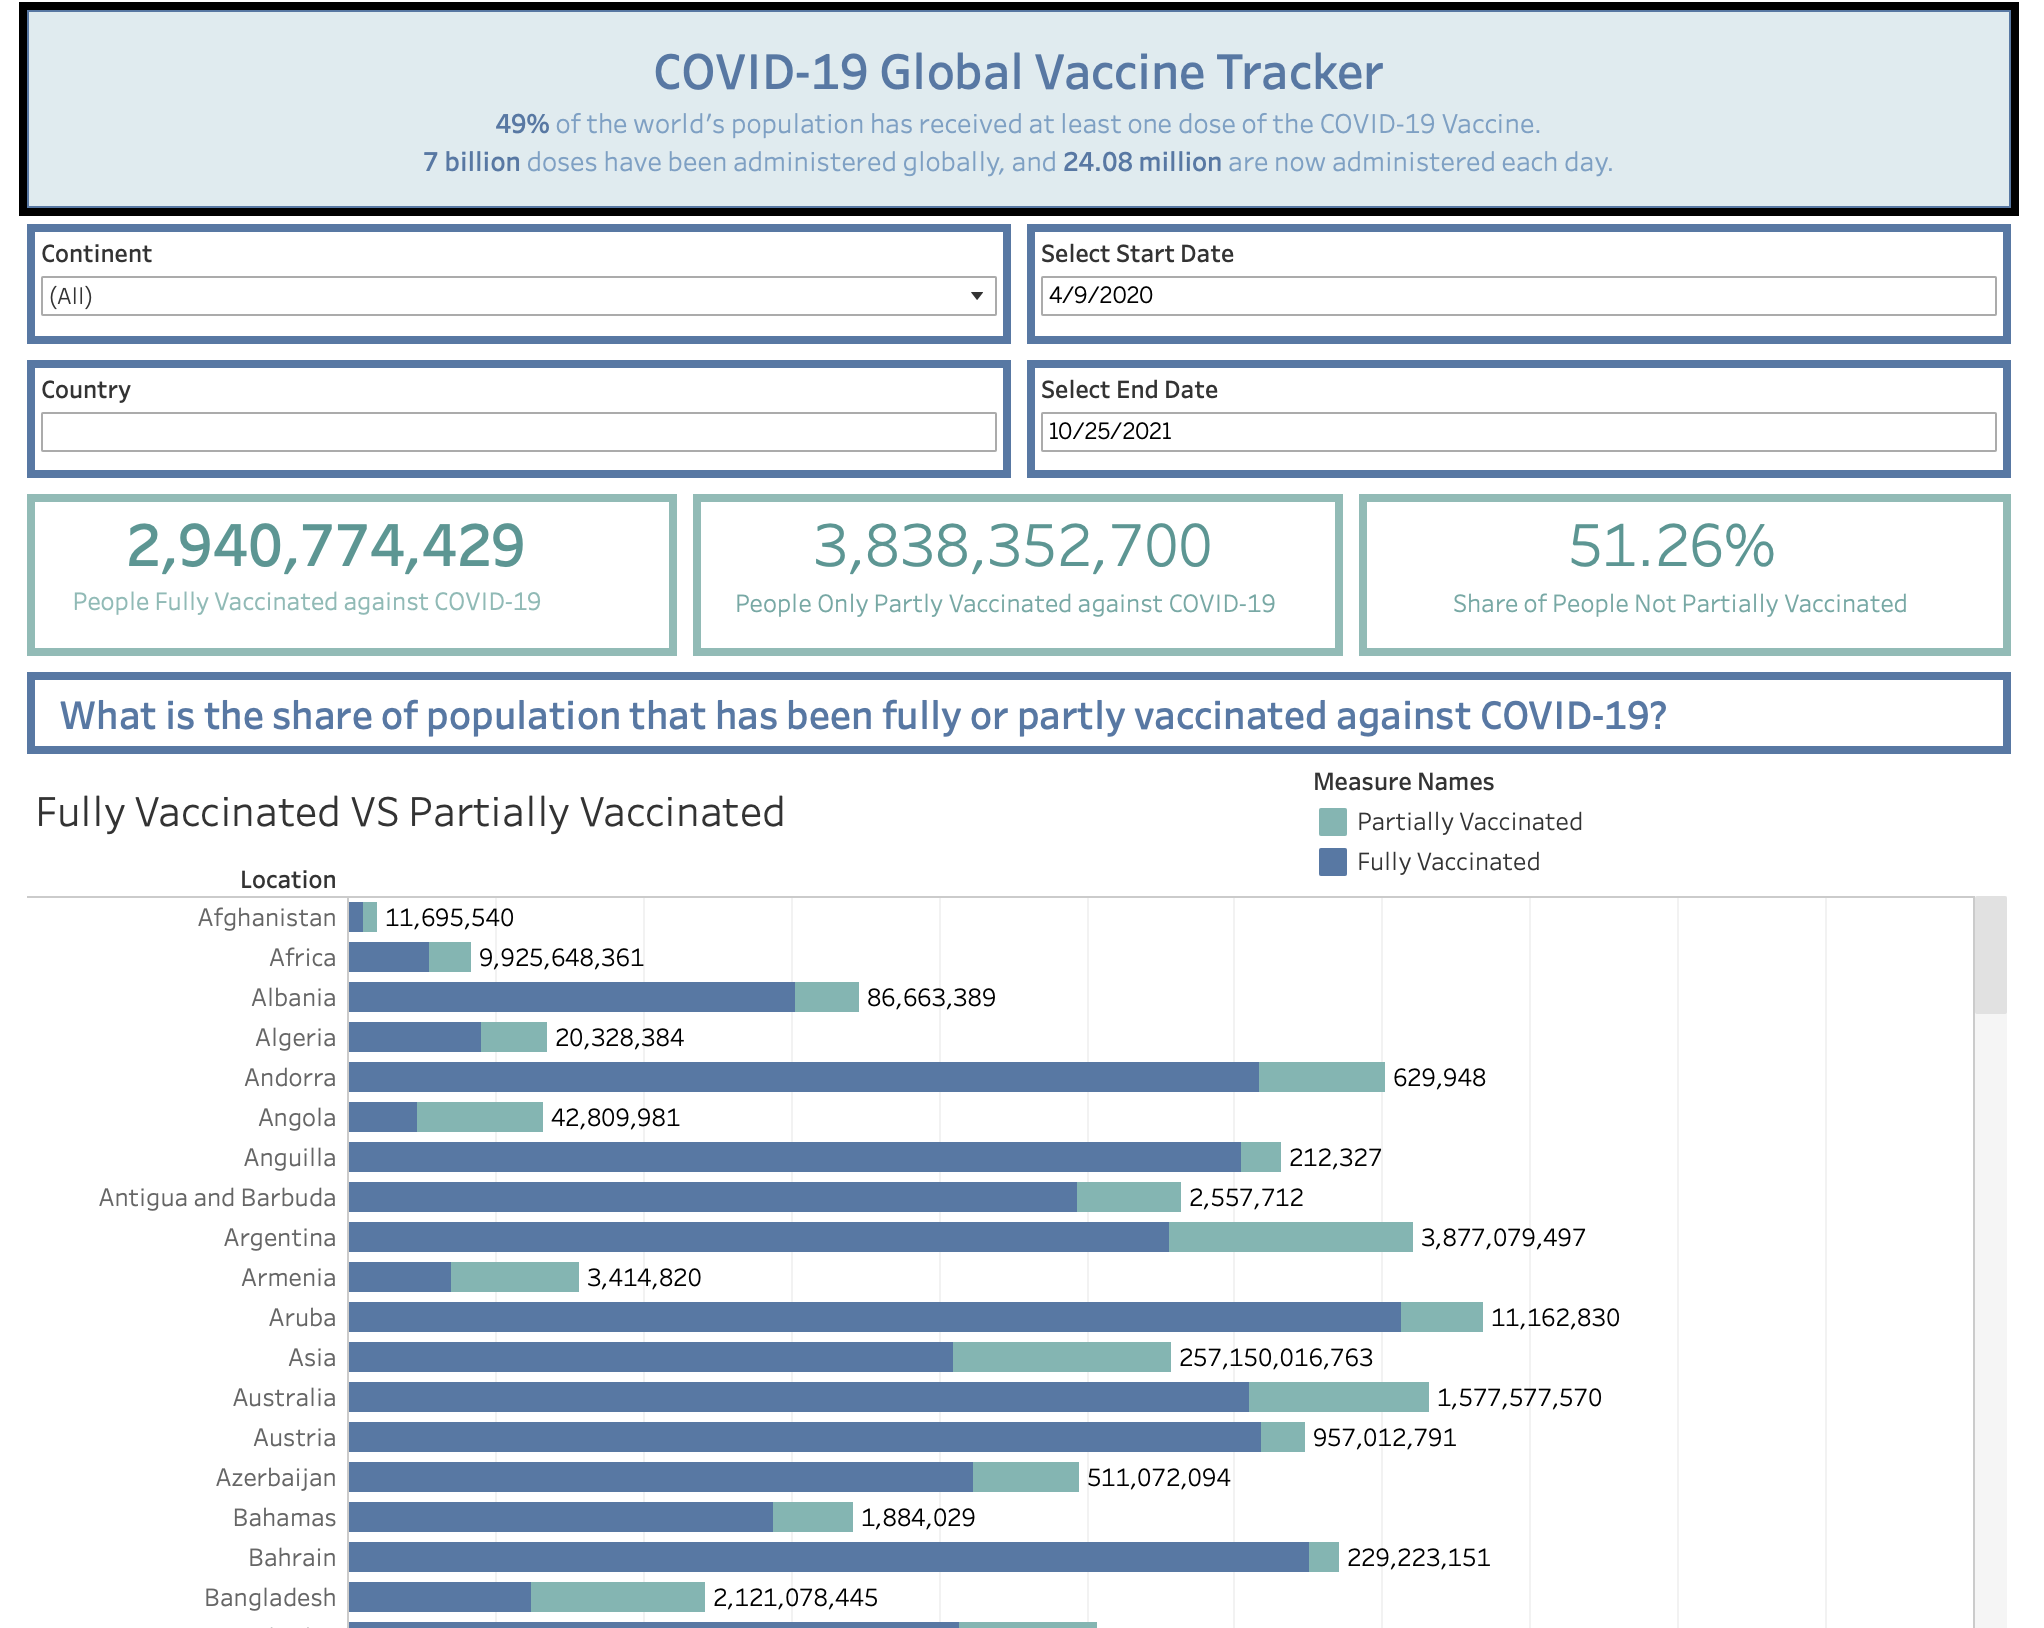
COVID-19 Vaccination Dashboard
● Designed and created a COVID-19 Vaccination Dashboard using Tableau that provided critical insights into the progress of the vaccination effort.
● Analyzed data on the number of doses administered, the number of people vaccinated, and other relevant metrics.
● Created visualizations such as time series analyses, age group breakdowns, and demographic data.

Personal Finance Dashboard
● Designed and created a Personal Finance Dashboard using Python that provides insights into personal finance such as budgeting, spending analysis, and investment tracking.
● Analyzed data on personal finance using Python libraries such as Pandas and Matplotlib.
● Created visualizations such as income vs expenses, monthly budget, and net worth.
● Communicated findings to users for better financial planning.

Data Cleaning using SQL
● Cleaned data using SQL by removing duplicates, missing data, and incorrect data.
● Ensured data quality by checking data consistency and data integrity.
● Improved data accuracy and made it ready for data analysis.
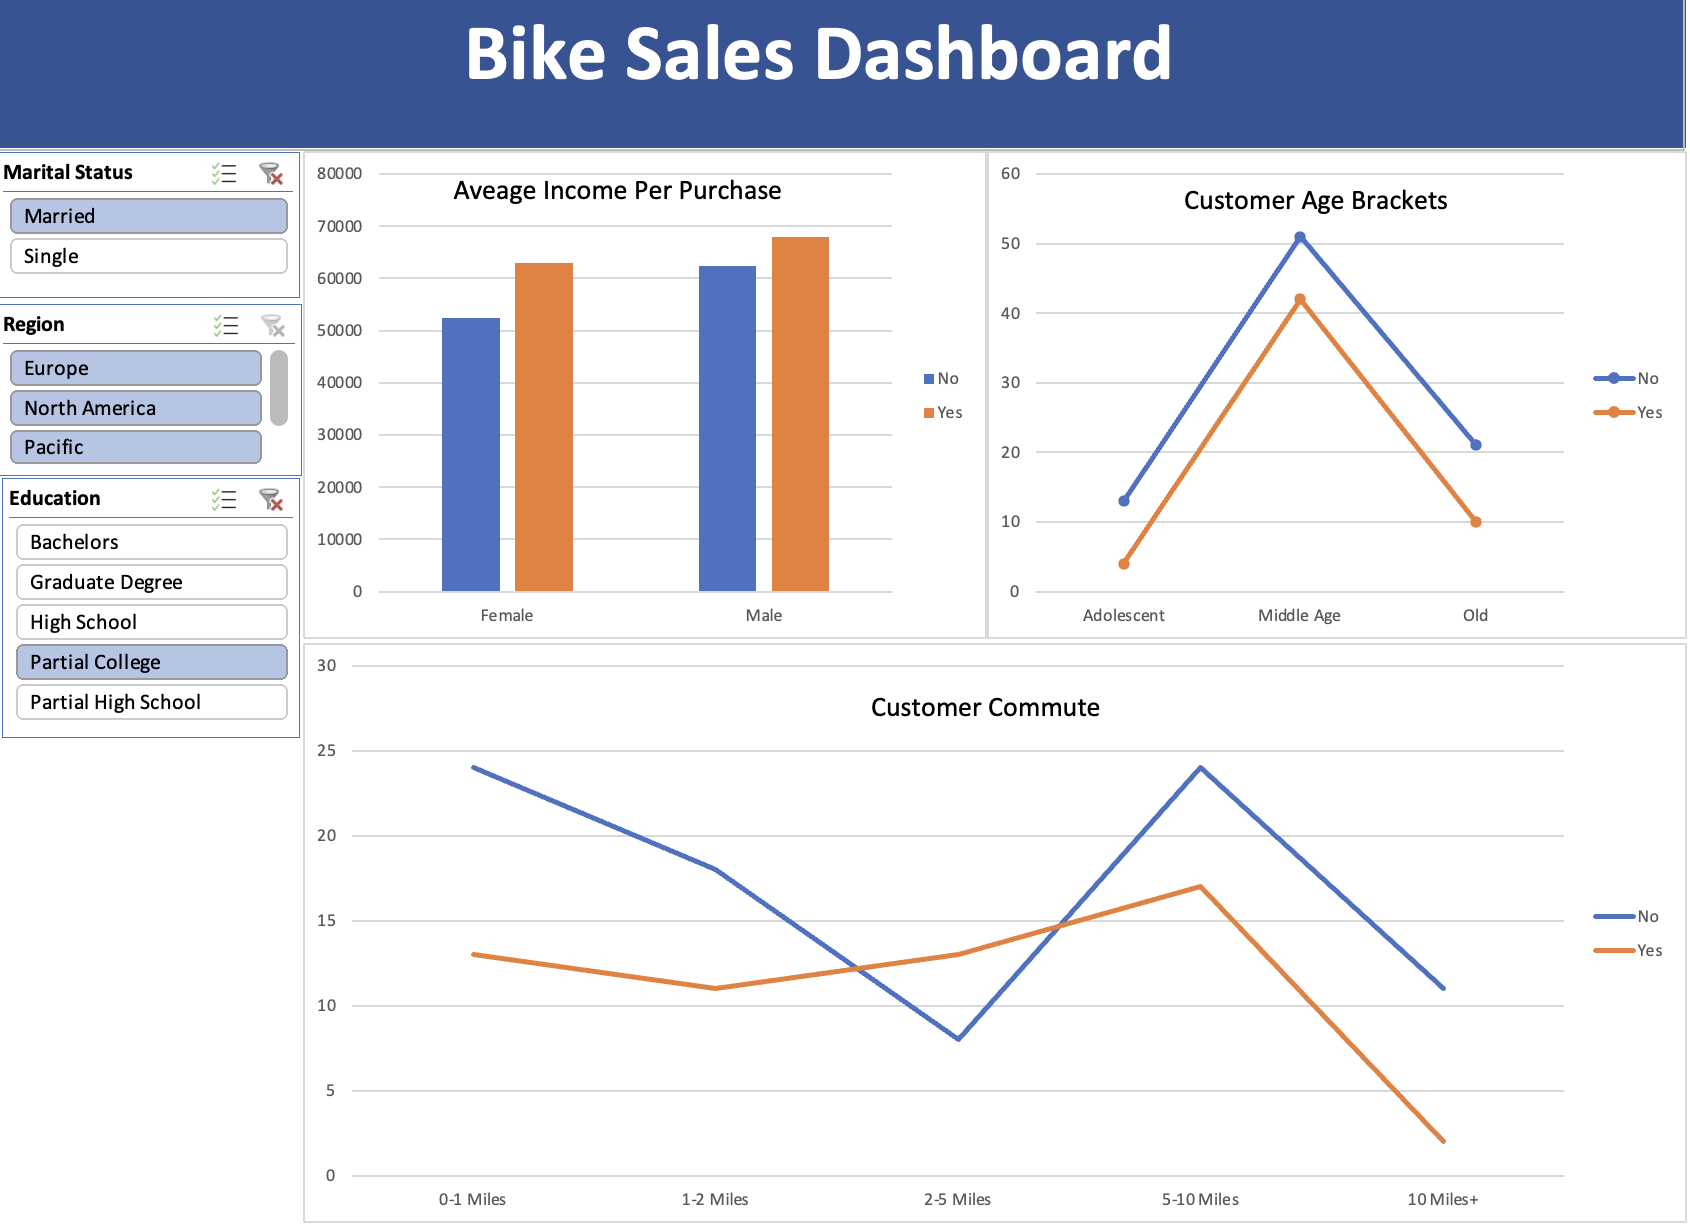
Bike Sales Dashboard
● Designed and created a Bike Sales Dashboard using Excel that provided insights into bike sales trends.
● Analyzed data on bike sales using Excel functions such as pivot tables and charts.
● Created visualization.

Amazon Web Scraper
● Created an Amazon Web Scraper using Python that extracts data from the Amazon website and converts it into a CSV file for data analysis.
● Extracted data such as product name, price, rating, and review count.
● Improved efficiency of data collection and made it more automated.

Twitter Sentiment Analysis using Python
● Designed and created a Twitter Sentiment Analysis using Python that analyzed tweets and classified them as positive, negative, or neutral.
● Analyzed data on tweets using Python libraries such as TextBlob and Pandas.
● Created visualizations such as word clouds, sentiment distribution, and top positive/negative words.